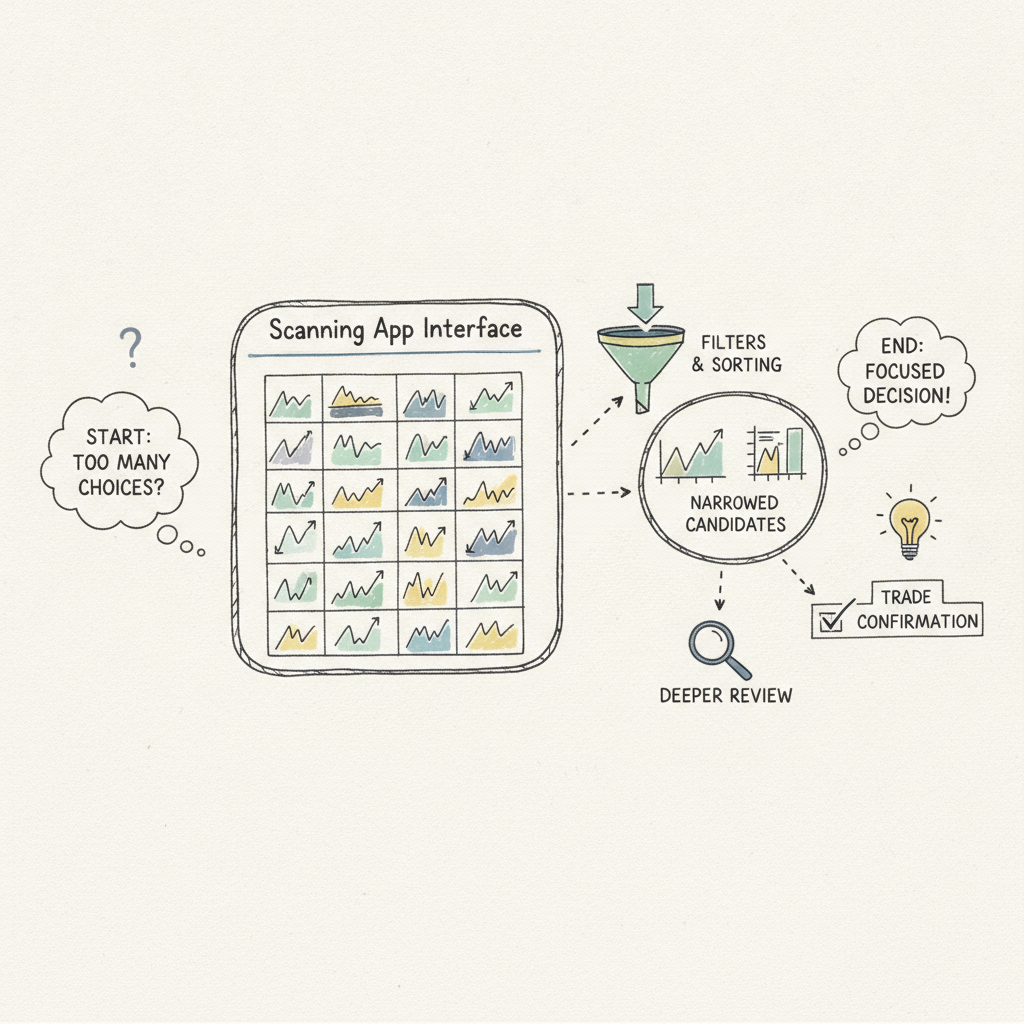
Filters and sorting are not search engines: they are candidate-narrowing tools
In 1k_scanner, filters and sorting are for narrowing candidates first, not for giving immediate trade confirmations. A practical workflow for trading-focused scanning.
1k_scanner is not a document scanner. It is a Rust+egui based multi-market, multi-timeframe trading scanning app.
The core idea is simple:
Instead of searching for the right entry, use scanning to narrow your attention to a small set of candidates that are worth a deeper review.
So this guide is about using filter/sorting signals (including consensus cues) as a candidate narrowing routine.
1) Why narrowing comes first
When you first open 1k_scanner, it looks like a lot of charts at once. That is not noise; it is the starting point for narrowing down.
If you open charts one by one, the question becomes: “Which chart should I check next?”
With a scanning workflow, the better question is: “Which symbols should I review thoroughly for the next 2–3 minutes?”
In practice, the consensus hotlist/cues and your routine act as the “filters/sorting” that answer that question.
2) One-minute reset: lock the grid mental model
The grid is built as:
- Rows = timeframes
- Columns = symbols That means one column gives a multi-timeframe chain for the same symbol.
Now set the two core view modes:
Ctrl/Cmd + 7: dense grid
Ctrl/Cmd + 8: expanded grid A practical loop:
Use dense grid (Ctrl/Cmd+7) for a broad scan.
Use expanded grid (Ctrl/Cmd+8) to reduce candidates for deeper checks.
Switch back if you need broader context again. That is the essence of filtering: not seeing more, but deciding what to stop seeing.
3) 5-minute interpretation of EMA/NRZ: user-level use only
When many users first see EMA and NRZ, they may think these are “what to buy” signals. Use them as context checks instead.
EMA (persistence): quick read of how durable the larger directional context looks.
NRZ: quick read of whether pullback handling still feels structurally supported. In practice, ask only two questions:
Is this candidate aligned with the larger flow?
Does the post-pullback structure look like it can hold, or is it already fracturing? This keeps you from overfitting those two panes into instant actions.
4) Consensus signal: what the directional frame cue actually means
Consensus is not an execution signal.
Interpret it this way in daily use:
If multiple signs line up, you get a directional frame cue (long/short emphasis).
If signals are mixed, neutral, or weak, you get low-emphasis behavior. Even with a strong directional cue:
It does not mean “enter now.”
It means “this is the next set to validate.” Even with neutral/mixed cues:
It does not mean “take the opposite trade immediately.”
It may simply mean “watch less aggressively or pause.” Consensus is, in short, a way to allocate attention and review time.
5) Focus happens through Space
After you narrow to a few candidates, move from scan to focused validation.
Space: toggle single chart mode.
Keep moving within row/column so one symbol’s timeframes stay grouped. Prefer this sequence over immediate action:
Narrow in filter stage
Validate in single-chart stage
Return to list and repeat This loop is where consistency comes from.
6) Check-note routine: V to save, N to review
Most misses are not because the right symbol was absent. They happen because the observation rhythm was not captured.
Use this compact loop:
V: add/toggle the current chart in check-note.
N: open the CheckNote section and review. A simple 3-line format is enough:
Why this symbol became a candidate.
What was seen at the EMA/NRZ level.
Next action (observe more / execute setup / defer). This removes the “I forgot the reason” problem next session.
7) Template is your operation repeatability layer
If you skip this, your routine collapses after the first good session.
Create templateSet
Grid Size,Timeframes per row,Exchange, then runGenerate Template (by size).Save layout
F12stores the current workspace layout.Load layout
Ctrl/Cmd + Lopens the load dialog next time. At first, use two templates:Scan template: wide coverage for candidate collection.
Focus template: fewer charts for in-depth checking. That is your filtering pipeline in practice.
8) Practical 10-minute routine
- 0:00–1:30 Verify tab and grid state after launch.
- 1:30–3:30 Scan broadly in dense mode (
Ctrl/Cmd+7). - 3:30–5:30 Use EMA/NRZ as context checks to prioritize candidates.
- 5:30–7:00 Narrow candidates using the directional consensus cue.
- 7:00–9:00 Focus with
Spaceon 2–3 candidates and markV. - 9:00–10:00 Review with
N, then save/load layout (F12,Ctrl/Cmd+L). When you treat filtering this way, 1k_scanner becomes less about finding the perfect chart and more about protecting your decision rhythm.
Use it not to chase signals, but to keep your observation consistent.